Multi-user & multi-client capability
Simultaneously over 100 users are no problem
A holistic and consistent energy management is an ecological and economic factor for companies. Efficient energy management affects a large number of employees in the company, which is why consumption data and key figures must always be available, regardless of location and device. e-Gem supports you in this – 100% implemented in web technology, the open software integrates itself into any existing infrastructure and is also characterized by simple configuration and intuitive operation.
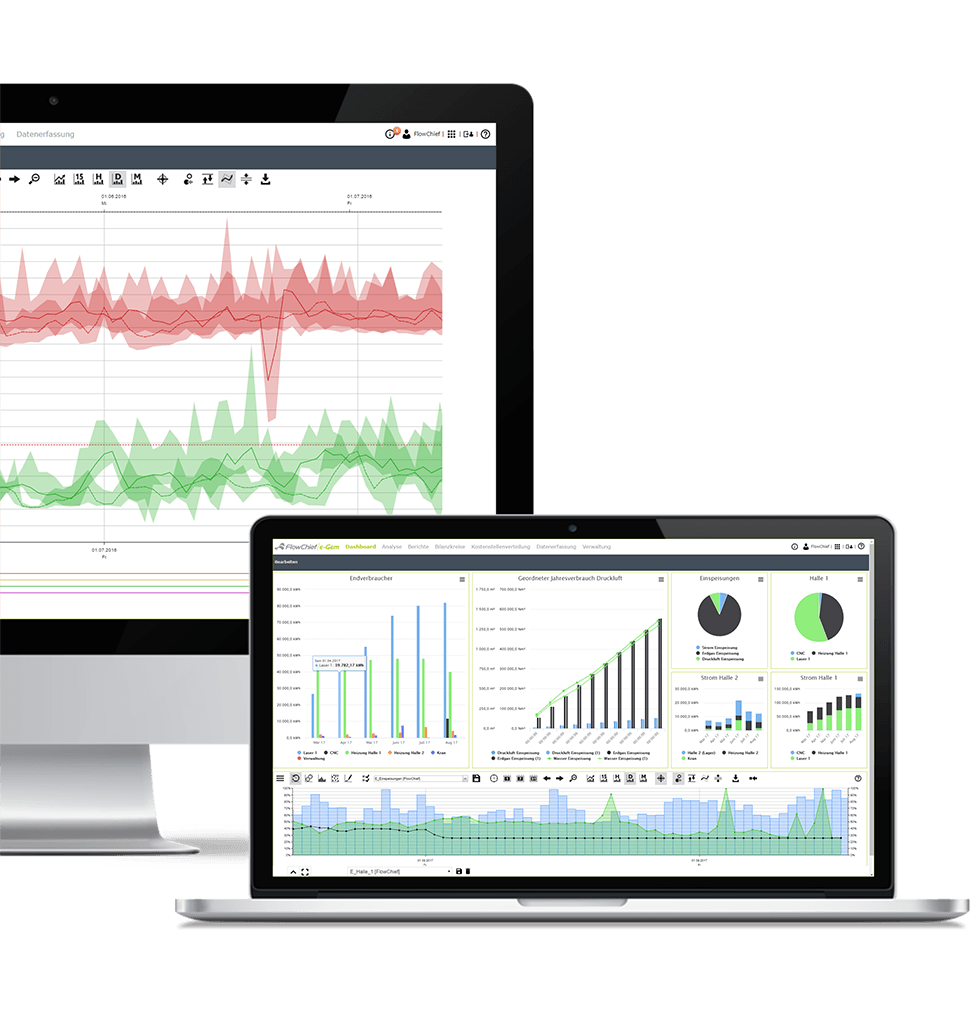
Energy data management in industry and business usually requires a heterogeneous measurement infrastructure. Universal measuring instruments, PLCs or data loggers serve as data sources. Data sources often have to be connected across locations. In addition to consumption data, also physical measured variables such as temperatures, pressures and above all master data or quantitative production data from ERP, MES or control systems must be recorded. e-Gem serves as a central platform for all processes in industrial energy management: All consumption data are archived without gaps and checked for plausibility. Measurement data, key figures, reports and dashboards are available to all parties involved in the energy management system throughout the company in a comprehensive and clear format.
SMEs are characterised by great know-how and a high degree of specialisation. Operating mostly globally, competitive pressure is enormous. The legislator, therefore, grants financial relief for the introduction of a resource-conserving working method. Since small and medium-sized companies often only have small personnel resources available for their energy management, an easy configuration and operation of the system are particularly important.
e-Gem has a simple and intuitive structure and allows automated and flexible manual recording of consumption data. The investment in an energy management software is worthwhile for medium-sized businesses since high savings can be achieved with little effort and the investment quickly pays for itself through cost reduction.
Energy suppliers are characterized by their extensive competence in the energy sector. In the competitive market, energy supply companies must also offer their customers energy management solutions. This strengthens customer loyalty and sets the company apart from the competition. In many companies, know-how in operational energy management is still at an early stage. Expert support in planning, integration and certification is gladly accepted. With e-Gem, suppliers can offer their customers service via a cloud solution or as an on-premises solution.
Energy Saving Contracting (ESC) is a business model that can be offered together with other energy services and ensures long-term customer relationships. e-Gem ensures that consumption data is reliably logged and available to the customer at all times. As a cloud-based portal solution, e-Gem offers the service provider a cost-effective way to support many of its customers on one system.
Sewage treatment plants and water supplies are real energy guzzlers in the municipal sector. Energy intense processes such as biological wastewater treatment have considerable savings potential. On the way to energetic optimization, there is no way around a continuous recording of all consumption data. e-Gem analyzes and monitors all energy values and converts them into meaningful key figures. This is how the energy consumption of a drinking water pump can be set in relation to the extracted water amount.
Multi-user & multi-client capability
Simultaneously over 100 users are no problem
Scalability
On-prem, virtualized or cloud – 10 or 20,000 metering points
Accounting & hierarchy formation
Parent / child meter – consumption data balancing
Historicization
Structures change – e-Gem adapts to them
Mapping of your structures
Counters, media, tariffs, key figures, cost centers, etc.
Security
Encrypted access, active directory & single sign-on
100 % web technology
Accessible. Always. Everywhere.
Data acquisition
Manual & automatic recording of all consumption, production and master data
Flexibly applicable to all collected data, the graph analysis integrated in e-Gem is the central front-end for determining hidden savings potentials. Flexible control functions such as mouse pointer, envelope curves, Limit values or Min/Max values together with modern Multi-Touch gesture control round off the intuitive user experience. Various formatting variants such as color, time report, resolution, diagram type (line, bars, area, etc.) can be easily selected with a mouse click. Once options and compilations have been made, they can not only be saved for private use but can also be flexibly shared between different users.
Reports can be created either ad hoc from existing master data, e.g. for a cost center, or manually using an integrated designer. In addition to classic tables, this allows the integration of diagrams such as pie charts, heat maps or Sankey diagrams. The reports can be implemented as WebReports in HTML, so that they are available platform-neutral on any web browser and on all devices. A Microsoft Excel-based reporting system is also available for complex company applications. Energy management reports can easily be sent to the responsible employees via the Reporting Service.
With the dashboard, you always have an overview of the most important data of your business – compact, simple and organized. Widget elements such as speedo, bar graph, aggregates or diagrams can be put together easily and intuitively. Also, visualization elements, text messages, Google Maps or webcams can easily be integrated. The responsive web design makes the dashboard suitable for all display sizes – PC monitor, tablet, or smartphone. In addition to simply duplicating existing dashboards and creating new ones, it is also possible to share them with colleagues, just by a single touch of a button.
e-Gem offers a variety of tools for evaluating archived data. Energy and media flows can be analyzed online and historically via Sankey diagrams or flow diagrams. With the heatmap, consumption patterns can also be identified over large periods. In general, Highcharts is a powerful chart engine that makes it possible to display extensive data simply and intuitively. Also, digital events such as operating messages or limit violations can be analyzed either chronologically or statistically in the message archive.
Interfaces such as OPC UA offer the possibility of capturing data practically in real-time. Current outputs, temperatures or aggregate states make it possible to recognize correlations for efficient plant operation. This data is available online for monitoring purposes. With the integrated visualization it is possible to create individual overview images and to navigate top-down to specific information.





Süwag customers benefit from many years of experience in energy management. The services include analysis of the existing measurement technology, measurement concepts, energy audits, integration of monitoring systems and support in terms of certification according to ISO EN 50001.
As a site operator, Infraserv Höchst offers its customers comprehensive energy services. The company’s own EnergyXpert® portal solution based on e-Gem is an elementary component of the portfolio. Current configuration: 5,400 real meters, 7,000 virtual meters, 37,000 quality variables, approx. 80 different media and products, 70 companies, 800 different users.
For the Koller Group, a supplier to the automotive industry, SPANGLER Automation has combined the advantages of machine and building control technology in FlowChief. The data are further evaluated in e-Gem. With this, specifications can be adhered to and e.g. the maintenance requirement can be recognized.
SPANGLER and the dumpling specialist Burgis relied on FlowChief for the construction of the new production facility. All processes from delivery and storage, sorting and washing to the production lines are recorded and documented. This is because strict regulations on traceability apply to food.
The SCHOTT technology group, which specializes in glass production, has been using FlowChief’s ISO 50001-certified energy data management system e-Gem since 2011. e-Gem acts as a data hub within the company. Energy planning, peak load optimization, billing and technical services continuously access the data and use it for their individual…
The decisive factor for a FlowChief process control system was the uniquely integrated overall concept. Apart from the FlowChief process control system, there is no product on the market that offers an innovative and plugin-free web visualization with powerful historization, reporting and alarm platform in one application.
We are looking forward to your inquiries and comments!
Wolfgang Voit
Leader Electrical Engnieering SKF Schweinfurt
We have many years of experience in the field of industrial data acquisition and energy management. This enables us to offer our customers a wide range of services. We create data acquisition concepts specially tailored to the customer and his measurement technology and integrate solutions for software-supported energy management on request. With e-Gem, we use an open and manufacturer-neutral solution that can be optimally integrated into existing measurement technology. In addition, all employees involved can easily gain access to the system via web technology. We also support our customers in operation and certification according to ISO 50001.

Lars Jenner
Solution Management B2B Energy+ Süwag Vertrieb AG & Co. KG
As a site service provider, we collect large amounts of data, which we make available to a great number of customers in various services. Until 2011, we used software that required an entire terminal server farm. The regular client updates alone caused an enormous amount of work and were no longer up to date. So we were looking for a pure web solution. Another important requirement was a software stack that could easily be extended to meet our requirements. With FlowChief we found a partner with suitable software and the necessary flexibility for our complex and demanding requirements.

Dirk Scheid
Business Partner Networks and Energy Management InfraServ Höchst
Approximately 50 employees in the company work with the system and access the application via browser without installing any additional software. This was one of the main reasons for the conversion to FlowChief process control technology. The effort became too great. Only a few employees had access to the system and were increasingly busy transmitting their consumption data to third parties. The prerequisite for a new system was therefore the non-discriminatory, continuous access via web browser. FlowChief offers all this.

Dipl.-Ing. Lothar Kretschmer
Head of Energy Management Schott AG
Several years ago, we worked out the actual energy situation in our Max Binder drinking water treatment plant as part of an energy concept and are successively implementing measures to reduce energy consumption. In the construction of the new waterworks in Moos, the energy-efficient design of plant and building services engineering was a high priority right from the start. An area-wide measuring infrastructure ensures that all consumption data is seamlessly collected in our central energy management platform e-Gem from FlowChief. We also record water quantities and can thus monitor and historically analyze the current energy performance for each sub-process such as the extraction, purification or distribution of our drinking water in high forest water quality.

Dipl.-Ing Hermann Gruber
Government Building Master and Plant Manager Water Supply Bayerischer Wald
The importance of effective energy management in a wide variety of sectors and in industry is constantly increasing. The reason for this are not only rising energy costs, but also sustainable corporate management, which is becoming more and more important in terms of external image. It goes hand in hand with extensive environmental management legislation and tougher competition.
In 2012, we decided to modernize the aging Repas AEG process control system. After an extensive market analysis, the choice fell on FlowChief. The decisive point was above all the uniquely consistent overall concept of the application – so there is no comparable product on the market, which offers a plugin-free web visualization with historian server and alarm platform combined. Meanwhile, we also trust FlowChief with our in-house energy data management.